
Core Web Vitals are Google’s three field metrics for loading speed, interactivity and visual stability: Largest Contentful Paint (LCP), Interaction to Next Paint (INP) and Cumulative Layout Shift (CLS). A page passes when it hits LCP ≤2.5s, INP ≤200ms and CLS ≤0.1 at the 75th percentile. Start by opening the Core Web Vitals report in Search Console or running PageSpeed Insights against your highest-traffic template.
TL;DR:
- Fixing LCP should be the top priority as it is the most commonly failed metric and offers the largest impact on overall scores.
- INP is the hardest metric to improve because it requires lasting JavaScript performance optimizations across user sessions.
- Common CLS fixes, such as reserving space for images and ads, often produce results within a single deployment cycle.
- Field data from CrUX and RUM tools must be prioritized over lab tests, as real user conditions often reveal issues lab simulations can’t detect.
- Ongoing monitoring after initial fixes is essential, since performance can regress due to new content, scripts, or plugins introduced post-launch.
Table of Contents
- What the three Core Web Vitals measure and their thresholds
- How Google measures Core Web Vitals: CrUX, p75 and lab versus field data
- Tools to measure and debug Core Web Vitals and when to use them
- Prioritised optimisation checklist: LCP, INP, CLS fixes mapped to impact and effort
- Audit and delivery workflow: from identifying problems to ongoing monitoring
- Common pitfalls and quick troubleshooting tactics
- Agency perspective: scoping Core Web Vitals work into real projects
- Impact of Core Web Vitals on mobile vs desktop user experience
- How Core Web Vitals integrate with other web performance metrics
- Latest updates and evolving standards in Core Web Vitals metric definitions
- Case studies: what before-and-after Core Web Vitals improvements typically look like
- Accessibility considerations related to Core Web Vitals improvements
- The gap between Core Web Vitals advice and what actually moves the needle
- Get your Core Web Vitals fixed by people who build the site too
- Sources
What the three Core Web Vitals measure and their thresholds
Each metric tracks a distinct failure mode, and Google grades all three against fixed numeric bands rather than a relative score.
Largest Contentful Paint (LCP) measures how long the biggest visible element (usually a hero image, banner, or heading block) takes to render. A page scores “good” at 2.5 seconds or below, “needs improvement” up to 4 seconds, and “poor” beyond that.
Interaction to Next Paint (INP) measures the delay between a user’s click, tap, or keypress and the moment the browser visually responds. It replaced First Input Delay (FID) in 2024 because FID only sampled the very first interaction on a page, while INP measures responsiveness across the entire page lifecycle, catching sluggish interactions further into a session. The bands: 200ms or under is good, up to 500ms needs improvement, above that is poor.
Cumulative Layout Shift (CLS) scores unexpected movement of visible elements, calculated by multiplying the impact fraction of shifted content by the distance it travels. A score of 0.1 or below is good, up to 0.25 needs improvement, and anything higher is poor.
- LCP: good ≤2.5s, needs improvement ≤4s, poor >4s
- INP: good ≤200ms, needs improvement ≤500ms, poor >500ms
- CLS: good ≤0.1, needs improvement ≤0.25, poor >0.25
Pro Tip: Google grades a page on its worst metric, not an average. A site with excellent LCP and CLS still fails overall if INP sits in “poor”.
None of these thresholds are averages. Google classifies a page group by its 75th percentile score, meaning three out of every four visits must meet the target for the page to pass. That single design choice explains why a site can “feel fast” in casual browsing yet still show as failing in Search Console.
How Google measures Core Web Vitals: CrUX, p75 and lab versus field data
Google doesn’t grade your site on a stopwatch test run in a lab. It uses the Chrome User Experience Report (CrUX), a dataset built from anonymised, opted-in Chrome users visiting your pages in the real world. CrUX groups data either by exact URL or, when traffic to an individual page is too thin for a reliable sample, by origin and template pattern.
The Core Web Vitals report in Search Console pulls from CrUX and classifies URL groups as Good, Need improvement, or Poor, based on that 75th percentile figure calculated over a rolling 28-day window. That window matters for planning: ship a fix today and you won’t see the classification update until the affected 28-day sample has largely turned over.
Lab tools work differently. Lighthouse runs a single simulated session on a fixed device and network profile, which makes it repeatable but not representative of your actual visitors, who arrive on wildly different phones, connections, and geographies.
- CrUX (field data): real Chrome users, 28-day rolling window, 75th percentile, what Google uses for ranking
- Lighthouse (lab data): single simulated run, useful for debugging and pre-launch checks, not for ranking status
- Field data variability across devices and networks means one lab pass never guarantees a CrUX pass
Use lab tools to diagnose and fix. Use field data to confirm you actually solved the problem for real visitors.
Tools to measure and debug Core Web Vitals and when to use them
Each tool in the Core Web Vitals toolkit answers a different question, and picking the wrong one wastes time.
- Search Console’s Core Web Vitals report gives you the site-wide view: which URL groups are failing, by which metric, and how many pages are affected. Start here to prioritise.
- PageSpeed Insights shows both field data (if the page has enough CrUX traffic) and a fresh Lighthouse lab run side by side, making it the fastest single-page sanity check.
- Lighthouse and Lighthouse CI provide repeatable synthetic audits, ideal for catching regressions in a build pipeline before code reaches production.
- Chrome DevTools’ Performance panel lets you record a live session, trace long JavaScript tasks, and pinpoint exactly which script or handler is delaying INP or triggering a layout shift.
- The web-vitals JavaScript library instruments real visitor sessions directly, feeding Real User Monitoring (RUM) data into your own analytics or a dedicated RUM platform.
Pro Tip: Lighthouse tells you what’s slow in theory; the web-vitals library and RUM tell you what’s actually slow for your visitors. Run both. Trust the field data for verdicts.
For sites with meaningful traffic volume, a commercial RUM tool adds continuous field measurement segmented by device, connection type, and geography, which is where the aggregate CrUX figure starts hiding useful detail. That segmentation matters more once you’ve fixed the obvious issues and need to chase the remaining outlier visits dragging your p75 score down.
Prioritised optimisation checklist: LCP, INP, CLS fixes mapped to impact and effort
LCP is the most commonly failed metric across the web, which makes it the natural first target for most audits. Fixing it typically delivers the biggest single jump in overall pass rate, before you touch INP or CLS at all.
LCP: reduce server delay and prioritise the hero resource
- Preload the LCP image or font with a
<link rel="preload">tag so the browser fetches it immediately rather than discovering it late in the page’s render sequence - Reduce Time to First Byte (TTFB) with a content delivery network (CDN) and server-side caching, since a slow first response delays everything downstream
- Convert hero images to modern formats (WebP or AVIF) and serve correctly sized versions per device
- Strip render-blocking CSS and JavaScript that delays the browser reaching the LCP element
INP: find and shorten long JavaScript tasks
A single slow interaction can be enough to fail INP at the 75th percentile, so instrumentation to catch that outlier visit matters as much as the fix itself.
- Use DevTools’ Performance panel to find tasks blocking the main thread for over 50 milliseconds
- Break large tasks into smaller chunks and yield to the browser between them
- Defer non-critical third-party scripts (chat widgets, analytics tags, ad scripts) until after the page is interactive
- Simplify event handlers that trigger expensive re-renders on every click or keystroke
CLS: reserve space before content arrives
- Set explicit
widthandheightattributes, or a CSSaspect-ratio, on every image and video - Reserve fixed space for ads, embeds, and dynamically injected banners before they load
- Avoid animations that alter layout properties like
topormargin; animatetransforminstead - Choose a font-loading strategy (
font-display: swapor a preloaded variable font) that avoids a visible reflow when web fonts finish loading
To confirm a fix worked, find the LCP element in DevTools’ Performance panel, review the network waterfall for blocking requests, and compare before-and-after figures through RUM immediately, then watch CrUX over the following 28 days for the official classification to catch up.
Audit and delivery workflow: from identifying problems to ongoing monitoring
Turning a Core Web Vitals audit into shipped improvements works best as a five-step cycle, not a one-off sprint.
- Audit: open Search Console’s Core Web Vitals report, identify which URL groups are failing and by which metric, then rank them by traffic volume and template, since fixing one template often resolves dozens of pages at once.
- Plan: map each failing metric to a specific fix, estimate the development effort, and note the expected impact, prioritising low-effort, high-traffic wins first.
- Deploy: run Lighthouse CI checks against a staging build, then verify runtime behaviour in DevTools before pushing to production.
- Verify: check RUM data immediately after launch for a directional signal, but expect Search Console and CrUX to take two to four weeks to reflect the change, since they report on a rolling 28-day window.
- Monitor: keep RUM running continuously, schedule periodic synthetic Lighthouse tests, and add CI gates that fail a build if a key page regresses past threshold.
Skipping step five is the most common mistake. A site that passes today can slip back into “poor” the moment a new plugin, tracking pixel, or unoptimised image ships without a performance check.
Common pitfalls and quick troubleshooting tactics
A lab score of 95 doesn’t guarantee a CrUX pass, and that gap catches out a lot of teams running audits for the first time.
- Lighthouse looks fine but CrUX still fails: check whether real users are on slower devices, weaker connections, or different geographies than your lab test simulated
- One outlier interaction tanks your INP: use RUM to isolate the specific page or user segment causing the slow interaction rather than assuming the whole site is affected
- Third-party scripts cause sudden regressions: audit tag managers, chat widgets, and ad scripts regularly, since a single vendor update can silently add hundreds of milliseconds
- Web fonts trigger a visible layout jump: pair
font-display: swapwith reserved space in your CSS so text doesn’t reflow the page once the font loads
Most regressions trace back to something added after the last audit, not something wrong in the original build.
Agency perspective: scoping Core Web Vitals work into real projects
Performance work only earns its budget when it’s scoped properly. Core Web Vitals can be treated as a three-stage engagement inside a redesign or an ongoing maintenance retainer: audit the failing templates first, fix the highest-traffic pages, then hand over continuous monitoring so gains don’t erode after launch.
Small businesses rarely need every possible optimisation. The highest return usually comes from fixing the one or two templates carrying most of the traffic, not chasing a perfect score across every page on the site.
Pro Tip: Before committing budget to a full rebuild, ask for a Search Console export showing which URL groups fail and by which metric. It tells you exactly where the effort should go.
Impact of Core Web Vitals on mobile vs desktop user experience
Google collects separate Core Web Vitals data for mobile and desktop, and the two often tell different stories for the same site. Mobile visitors typically hit slower processors, less reliable connections, and more variable network conditions, which pushes LCP and INP figures worse than the equivalent desktop session on the same page.
CLS behaves differently across the two as well. Smaller mobile viewports magnify the visual impact of a shifting element; a banner ad that nudges content down by 40 pixels barely registers on a wide desktop screen but shoves an entire mobile layout out of position.

Since CrUX field data reflects your actual visitor mix, a site with predominantly mobile traffic will see its overall Core Web Vitals classification skew towards its mobile figures, even if desktop performance is excellent. Search Console reports the two separately, and it’s worth checking both rather than assuming one represents the site.
Practical mobile-specific priorities include serving appropriately sized images rather than scaling down desktop assets in the browser, minimising main-thread work on lower-powered devices, and testing on mid-range hardware rather than the newest flagship phone. A mobile-first layout approach that reserves space for dynamic content from the outset avoids much of the CLS trouble that appears when a desktop-first design gets awkwardly compressed onto a smaller screen.
How Core Web Vitals integrate with other web performance metrics
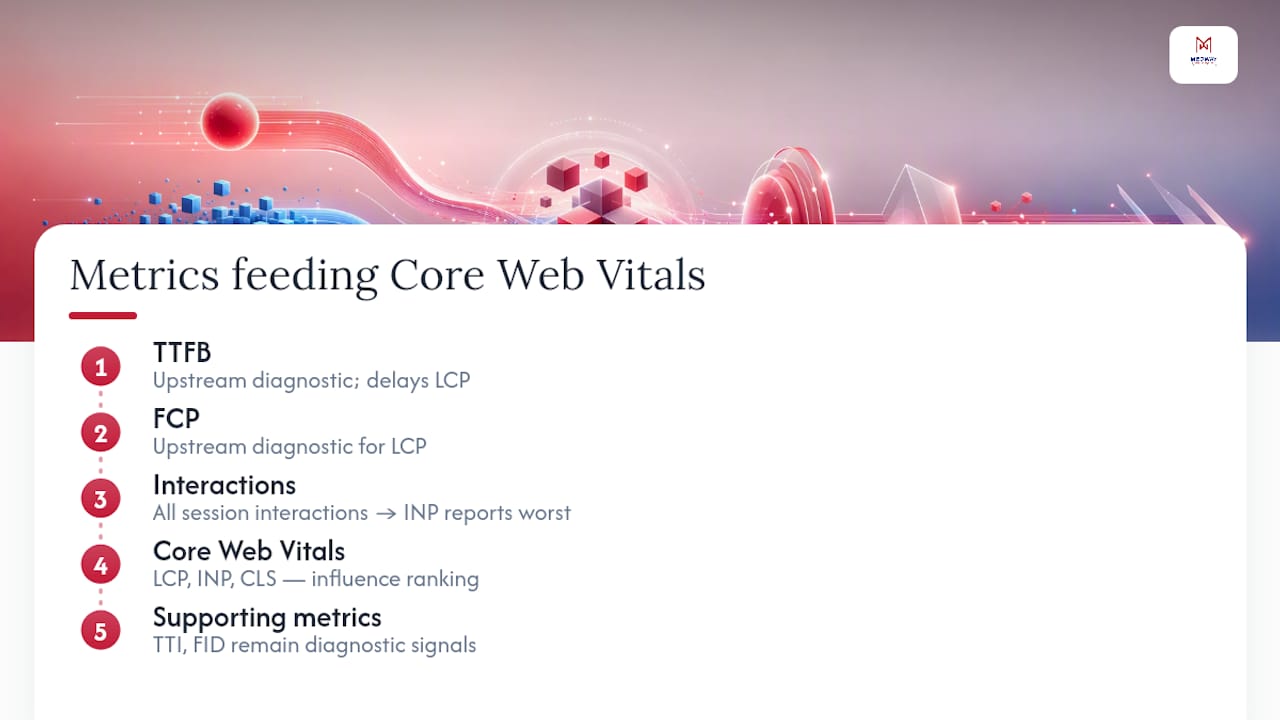
Core Web Vitals sit alongside a wider set of performance metrics, and understanding how they relate helps when a fix to one number doesn’t move another the way you’d expect.
Time to First Byte (TTFB) measures how long the server takes to send the first byte of a response, and it directly feeds LCP: a slow TTFB pushes back every subsequent render event, no matter how well-optimised your front-end code is. Fixing TTFB with a CDN or better server-side caching is often the single highest-leverage change available, because it improves LCP without touching a line of application code.
INP’s predecessor, First Input Delay (FID), only measured the delay before the very first interaction on a page. INP measures every interaction throughout the session and reports the worst representative value, which is why a page can have looked fine under FID and still show real responsiveness problems under INP. Other metrics like First Contentful Paint (FCP) and Time to Interactive (TTI) still appear in Lighthouse reports as diagnostic signals, but they don’t factor into Google’s ranking classification the way the three official Core Web Vitals do.
Treat TTFB and FCP as upstream diagnostics that explain why LCP or INP might be struggling, rather than separate targets to chase independently.
Latest updates and evolving standards in Core Web Vitals metric definitions
The 2024 replacement of FID with INP was the most significant change to the Core Web Vitals framework since its introduction, and it reset how developers approach interactivity work. Because INP evaluates responsiveness across the full page lifecycle rather than a single first click, sites that scored well on FID sometimes discovered genuine responsiveness problems for the first time once INP became the standard.
Google and the Chrome team continue to refine how thresholds are calculated and documented, and the rationale behind the specific numeric bands reflects an ongoing balance between what’s genuinely achievable for typical websites and what actually correlates with a visitor’s sense of a page feeling fast. That balance shifts as average device performance, network speeds, and typical page complexity change over time.
For anyone auditing a site in 2026, the practical takeaway is to treat Core Web Vitals as a moving target rather than a fixed checklist. Metric definitions have changed once already within the past few years, and staying subscribed to Search Console’s own guidance is the most reliable way to catch a threshold change before it catches you out.
Case studies: what before-and-after Core Web Vitals improvements typically look like
The clearest before-and-after pattern shows up when a site fixes its LCP resource loading. A page relying on a large, unoptimised hero image with no preload directive commonly sits well into “poor” territory; adding a preload tag, converting the image to a modern format, and moving it onto a CDN can shift that same page into “good” territory within a single CrUX reporting cycle, since these are among the highest-leverage fixes available.
INP improvements tend to show a more gradual pattern. Because a single slow interaction can fail the 75th percentile threshold, teams often need several rounds of instrumentation and fixes before the p75 figure moves cleanly into “good”, particularly on pages with heavy third-party script loads like live chat widgets or advertising tags.
CLS fixes are usually the fastest to show measurable improvement, since reserving space for images and embeds is a contained front-end change that doesn’t depend on server infrastructure or a wider content delivery strategy. A page riddled with shifting ad units or late-loading fonts can often move from “poor” to “good” CLS within a single deployment, well before the 28-day CrUX window even closes.
Across all three metrics, the pattern holds: field data confirms the win, but it always lags the fix by weeks, not days.
Accessibility considerations related to Core Web Vitals improvements
Fixing Core Web Vitals and improving accessibility overlap more than most audits acknowledge. Reserving layout space to fix CLS, for instance, also benefits users navigating with screen magnification software, who rely on predictable page structure to avoid losing their place when content shifts unexpectedly.
Deferring non-critical JavaScript to improve INP can affect keyboard navigation if not handled carefully. If focus management scripts load late, keyboard users may find themselves unable to tab through interactive elements until the deferred code finishes executing, so test keyboard flows after any script-deferral change rather than assuming a performance win is accessibility-neutral by default.
Font-loading strategies chosen to prevent CLS also interact with readability. A font-display: swap approach that flashes unstyled text briefly is generally preferable, from an accessibility standpoint, to a strategy that leaves the page blank while a custom font loads, since content that’s visible immediately, even briefly in a fallback font, serves screen reader users and sighted users alike better than an empty screen.
Image dimension attributes added to fix CLS should be paired with meaningful alt text, not treated as a purely visual fix. The two changes often get made in the same code review, which makes it a natural point to audit both together rather than treating performance and accessibility as separate workstreams handled by different people at different times.
The gap between Core Web Vitals advice and what actually moves the needle
Most Core Web Vitals guidance treats the three metrics as equally urgent, and that’s where the conventional advice falls short. LCP is the metric worth fixing first on nearly every audit, not because it’s more important in principle, but because it’s the one most sites get wrong, and it responds well to infrastructure-level fixes like a CDN or a preload tag that don’t require touching application logic.
INP gets treated as a checkbox exercise when it’s actually the hardest metric to fix properly, because it demands genuine engineering time spent breaking up JavaScript rather than a configuration change. Teams that skip straight to CLS quick wins because they’re easy are solving the least consequential problem first.
The bigger issue is verification culture. Plenty of teams ship a fix, glance at a green Lighthouse score, and move on, without ever checking whether CrUX confirms it weeks later. A lab score is a hypothesis. Field data is the answer. Build monitoring into the workflow from day one, or you’re optimising blind.
— Ian Rickard
Get your Core Web Vitals fixed by people who build the site too
Fixing Core Web Vitals in isolation only gets you so far when the underlying template, hosting setup, or plugin stack keeps reintroducing the same problems. A Core Web Vitals audit can be folded directly into web design and redesign projects, meaning the fixes for LCP, INP, and CLS happen at the build stage rather than as a bolt-on afterwards.

A typical engagement starts with a full audit against Search Console and PageSpeed Insights data, moves into prioritised template-level fixes (image delivery, script loading, layout stability), and finishes with ongoing monitoring built into a maintenance retainer, so gains don’t quietly erode six months after launch. This approach mirrors the wider connection between user experience and organic growth, where performance improvements compound with other on-site signals rather than acting in isolation.
If your site is showing “poor” or “needs improvement” in Search Console and you’d rather have it built right than patched repeatedly, take a look at MedwayWebDesign’s business web design guidance for small businesses can be consulted for more information about scoping an audit.
Sources
Google’s own Core Web Vitals documentation is the definitive reference for thresholds and ranking context. For the reasoning behind those numeric bands, web.dev’s threshold methodology explains the trade-offs Google weighed. Search Console’s own Core Web Vitals report help page covers exactly how URL grouping and the 28-day window work. For implementation, web.dev’s top fixes guide remains the sharpest practical starting point, and MedwayWebDesign’s speed optimisation checklist translates the same priorities into a build-stage workflow.
- Understanding Core Web Vitals and Google search results
- Core Web Vitals report – Search Console Help
- Web
- How to Improve Core Web Vitals in 2026 (LCP, INP, CLS Guide)